
Nine Months That Repriced Europe's Energy Risk
A war in the Gulf, a turn in monetary policy and a $700bn compute build-out have rewritten the assumptions behind most European energy and infrastructure business cases. What changed in 2026, what did not, and what boards should do before year-end.
The short version
- The Hormuz shock became a regime, not a spike. Brent is back above $100 and Qatari LNG remains largely offline. Planning cases built on 2025 forward curves are out of date.
- Monetary policy has turned. The ECB and the Fed are both raising rates again. Cost of capital now drives valuation gaps as much as commodity prices do.
- Europe's power problem is about shape, not volume. Record solar output coexists with an August average day-ahead price of €127/MWh.
01 · GeopoliticsA shock that did not fade
On 28 February, US and Israeli strikes on Iran triggered the effective closure of the Strait of Hormuz. Within days QatarEnergy halted production and declared force majeure, and insurers withdrew cover for Gulf transits. Brent crossed $100 on 8 March and closed March at $118, the largest monthly rise on record. The IEA coordinated a 400-million-barrel emergency stock release, and the agency described the disruption as the largest in the history of the oil market.
Markets then priced a resolution that did not hold. A ceasefire in April, a memorandum of understanding in June and a renewed collapse of the truce in July sent Brent from $72 on 1 July back above $100 by early October. Crude exports through the strait recovered to pre-war levels by late September, but fuel and LNG shipments remain constrained, transit is subject to Iranian control, and ships on unauthorized routes have continued to face attacks.
The lesson for planners is not the price level. It is that the distribution of outcomes widened and stayed wide for seven months. A single "geopolitical premium" line in a model is no longer an adequate treatment of this risk.
02 · GasEurope enters winter on a thin buffer
EU gas storage stood at 73% on 6 October, the lowest level for that date since records began in 2011 and about 15 percentage points below the five-year average. TTF moved above €80/MWh in September, its highest level since January 2023. Qatar has extended force majeure on deliveries to European buyers through December, and LNG transits through Hormuz remain roughly 80% below February levels. From January, the EU's phase-out of Russian LNG removes a further source of flexibility.
Winter 2026/27 is therefore a weather trade with asymmetric price risk. A mild season keeps the system whole. A cold January would force Europe to bid against Asia for US cargoes at the margin.
For industrial buyers, hedge ratios and contract indexation belong on the board agenda in October, not in December.
03 · PowerRecord solar, higher prices
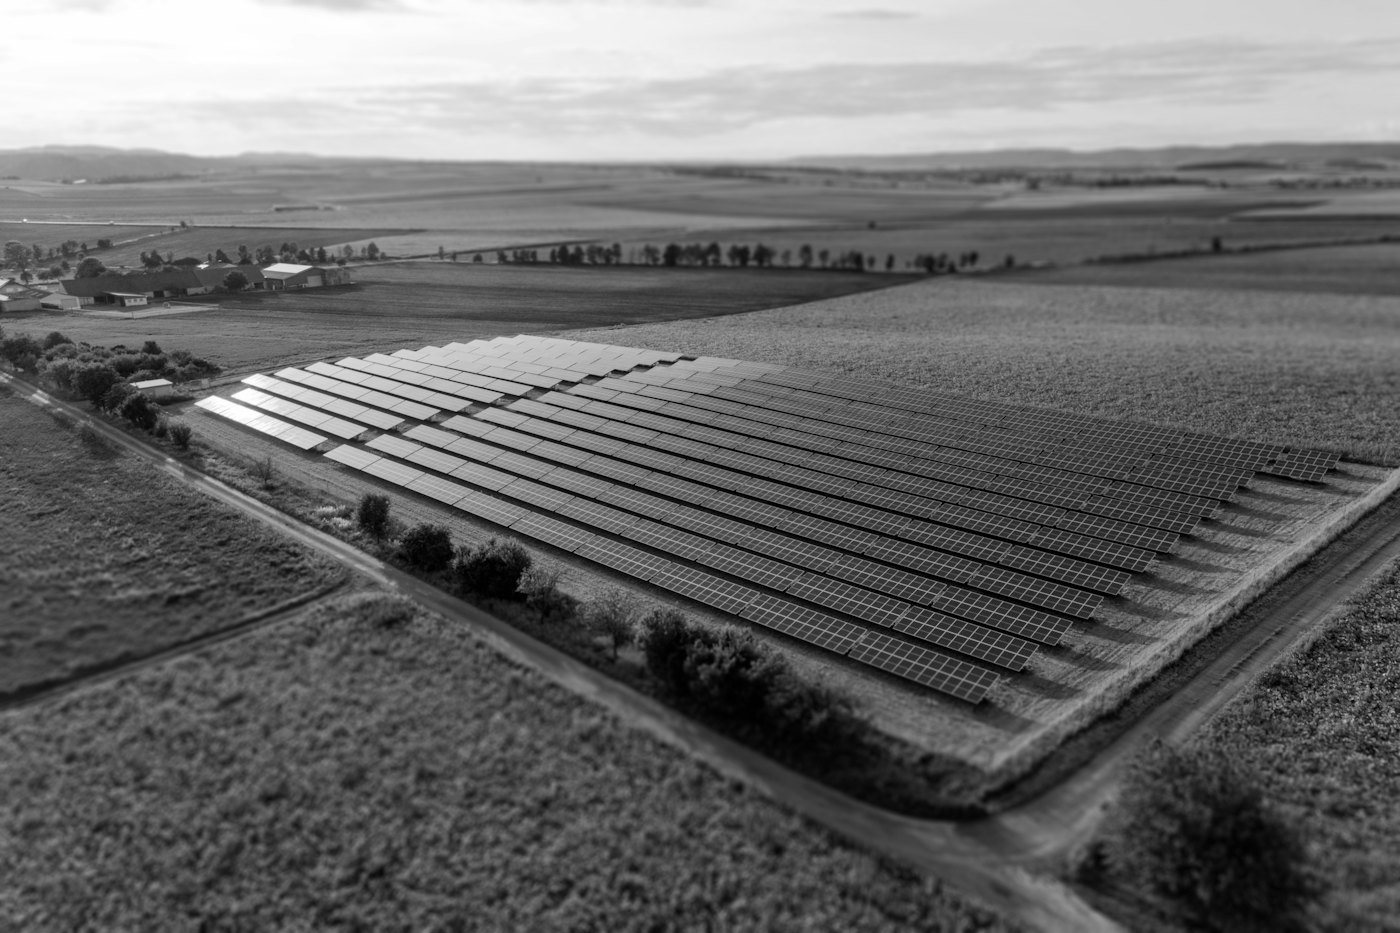
Solar generation in the EU rose by 36.4 TWh between January and August, the largest annual increase on record, and clean sources supplied 73% of EU electricity. Yet the average EU day-ahead price rose 59% between April and August, to €126.7/MWh. Heatwaves, Nordic hydro reservoirs 23% to 39% below 2025 levels and French nuclear availability falling to about 80% put gas back at the margin in more hours. In the first quarter, negative-price hours across the EU doubled year on year, from 593 to 1,223, led by Spain, Portugal and Greece.
Both facts are true at once. The system is short of firm, flexible capacity in some hours and long on undifferentiated solar in others. Value is migrating to whoever controls the shape of supply: storage, flexible thermal plant and demand response. Brussels' approval on 2 September of a German capacity mechanism worth up to €35bn confirms that dispatchable capacity will increasingly be paid for availability, not only for energy.
One caution for investors. The war widened intraday and balancing spreads, which flatters 2026 storage revenues. Underwriting should not annualize them. Our earlier work on solar capture rates and battery revenue compression still holds once the scarcity premium normalizes.
04 · RatesMoney became more expensive again
The ECB raised rates on 11 June and again on 10 September, taking the deposit rate to 2.50%. Euro area inflation reached 3.3% in August, and the bank now expects a return to target only at the end of 2027. The Federal Reserve raised its range to 3.75–4.00% on 16 September, its first increase since 2023, with headline inflation at 3.4% and most officials signalling a further hike this year.
For long-duration infrastructure, this matters as much as the commodity deck. In several of the valuations we reviewed this year, the move in the discount rate explained more of the bid-ask gap than the change in price assumptions. Sellers anchored on 2025 multiples and buyers working with 2026 financing costs are not negotiating over the same asset.
05 · CapitalCompute, grids and consolidation
The four largest US hyperscalers are on track for $700bn to $725bn of capital expenditure in 2026, about 75% above 2025. That spending now absorbs nearly all of their operating cash flow and is increasingly financed with debt, at rising rates. In the regions that matter, the binding constraint is grid connection and firm power, not chips.
Capital followed the constraint. Power and utility M&A reached a record $205bn in the first half, led by NextEra's $66.8bn agreement with Dominion. In Europe, first-quarter M&A rose 38% year on year to €332bn, and Engie's £10.5bn acquisition of UK Power Networks showed where long-term money wants to be: regulated networks with visible growth. At the other end, energy-intensive chemicals are shrinking, with several global owners exploring exits from European assets.
06 · PolicyTrade risk changed form, not direction
The US Supreme Court struck down tariffs imposed under the International Emergency Economic Powers Act on 20 February. The administration replaced them within days with a temporary Section 122 surcharge and accelerated Section 301 investigations. For European exporters, the legal route changed while the exposure remained. On the eastern flank, there is still no progress toward a Russia–Ukraine settlement, so European gas planning should assume no peace dividend.
07 · AgendaWhat boards should do before year-end
- Replace point forecasts with ranges. Re-run 2027 budgets and impairment tests against a low, central and stressed commodity case, and document which decisions change between them.
- Close the winter exposure. Review hedge ratios, indexation clauses and take-or-pay positions for gas and power through the first quarter of 2027.
- Re-underwrite flexibility on normalized spreads. Storage and peaking assets should clear the hurdle rate without 2026 scarcity revenues.
- Reprice the cost of capital. Test every live investment case at a discount rate at least 100 basis points above the version approved last year.
- Treat grid access as a strategic asset. In site selection and M&A, connection capacity and firm-power options are now worth more than many of the assets attached to them.
2026 has been less a year of new trends than a stress test of existing ones. Security of supply, flexibility and capital discipline moved from strategy documents into the P&L. The companies that leave this period stronger will be those that model ranges rather than points, pay for optionality before they need it, and keep balance-sheet capacity for the assets others will be forced to sell.
Figures as of 8–10 October 2026 unless stated otherwise. Data: IEA, ECB, Federal Reserve, GIE AGSI+, Eurelectric, Deloitte, Mergermarket, company disclosures and market data. This article is provided for information purposes only and does not constitute legal, investment or compliance advice. While believed to be accurate at the time of publication, Siller Advisory GmbH makes no representation as to its completeness and disclaims any liability arising from its use. © 2026 Siller Advisory GmbH. All rights reserved.